
ChatViz
Visualize data effortlessly with AI-powered insights.
Quick facts
- Best for
- Data visualization
- Pricing
- Freemium
- Editor rating
- 4.5 / 5
- Community saves
- 0
About ChatViz
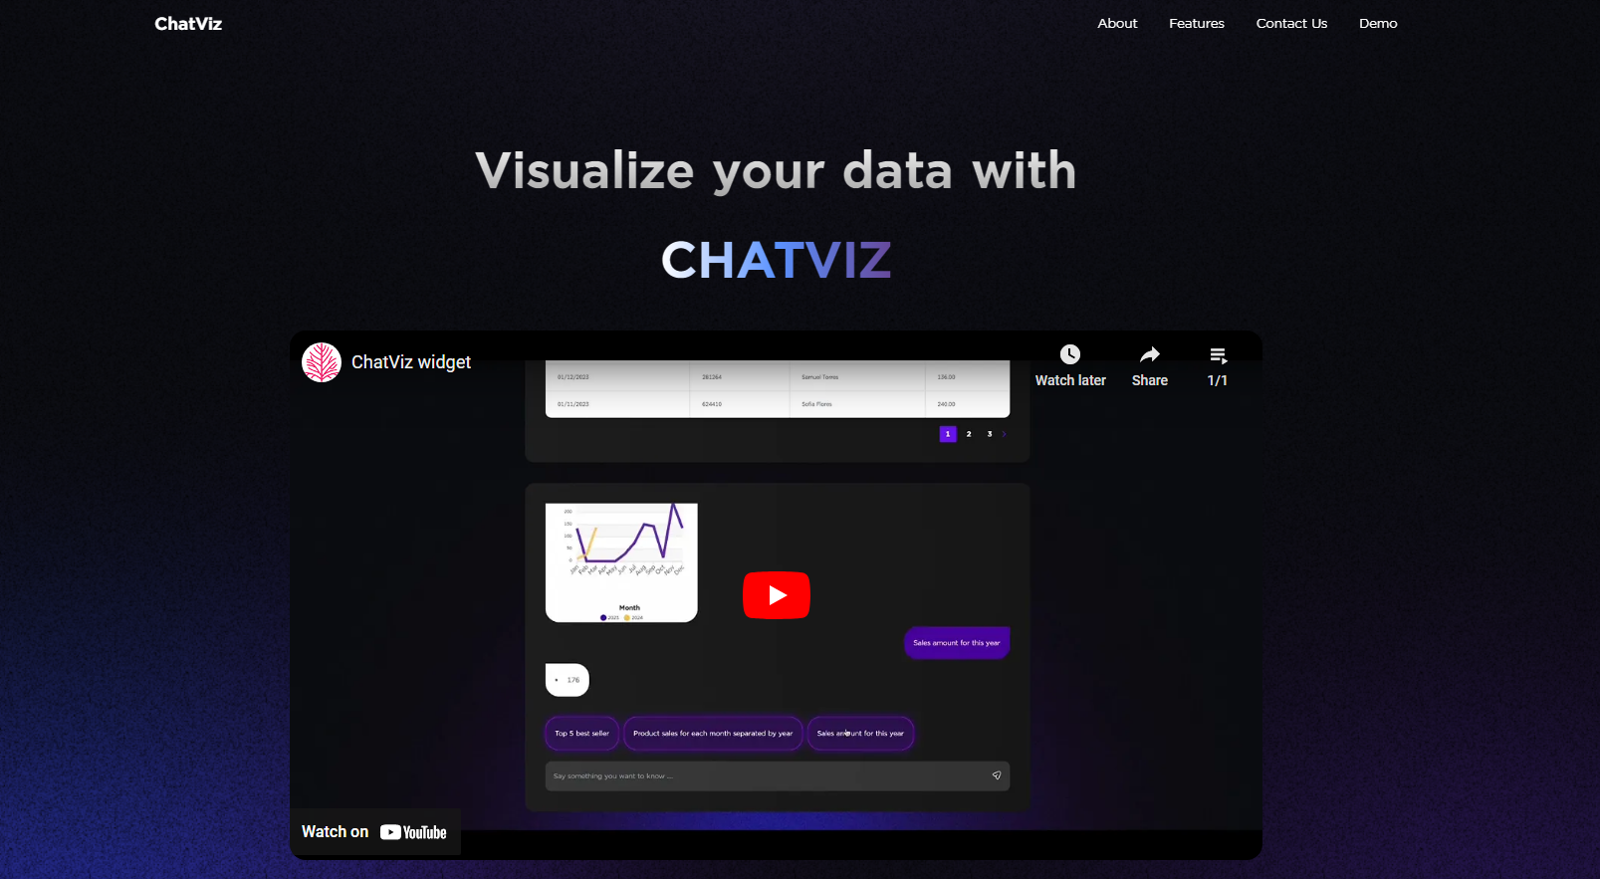
ChatViz is a tool designed to strengthen data visualization capabilities using ChatGPT. It possesses two core features. The first, an SQL translator, takes user input commands and rapidly creates the matching SQL queries. This streamlines the interaction between the user and their SQL database, as it lowers the necessity for extensive SQL knowledge. The second feature is an automated chart generator that can suggest charts most suited to a specific dataset provided by the user. This feature simplifies the process of selecting the most appropriate data representation format. Using ChatViz can improve user experience during data visualization and hastens the implementation process. Offering a solution to the often faced dashboard complexity, it introduces a novel way to visualize data. The tool consists of a configurable ChatViz widget. To use this tool, the user needs to configure their SQL schema to ChatViz and set up a webhook to communicate with ChatViz. After doing so, ChatViz will visualize the output data from the webhook. This approach aims to decrease development time by automating the process of data visualization.
Pros
- SQL translator feature
- Automated chart generator
- Reduces SQL knowledge necessity
- Improves user experience
- Hastens implementation process
- Simplifies data representation selection
- Resolves dashboard complexity
- Configurable Chat
- Viz widget
- SQL schema configuration
- Webhook setup for communication
- Decreases development time
Cons
- Requires SQL schema configuration
- Webhook setup required
- Limited data representation formats
- No customization options for charts
- No direct database interaction
- Dependent on Chat
- GPTPossible misunderstandings in translations
- Lack of user guidance
- Only suggests charts, not generates
- Limited widget configuration